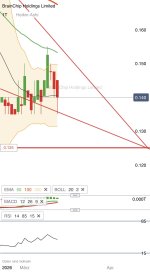
Here’s a brief chart analysis from me. I’d love to hear other opinions on this. The current price is 0.14. The lower trend line from the logarithmic weekly chart is currently at 0.125. I still think a bounce is possible. The short sellers might still have some ammunition left. Hopefully, they won’t achieve their main profit through a BRN bankruptcy. So they should also start thinking about switching sides. The last three weekly candles were doji candles. That doesn’t exactly suggest control over a further stable downward move. Absolute market uncertainty. The triangle on the daily chart ends in mid-April and has been recognized by the market. Anything can still happen until then. The lower wedge trend line keeps acting as a resistance zone. Only when the upper wedge trend line is broken and, ideally, confirmed from above, do I see light at the end of the tunnel. Then the price should head toward the target of this triangle. That’s how I interpret the chart.