Technical Analysis

So painful to watch
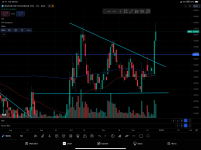
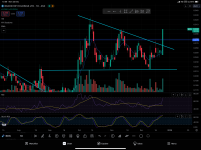
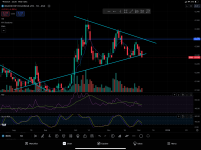
Now the SP has slipped below the lower tine of the PF it has 3 days to climb back above.
Levels of support from here include;
FIB @23.5
MMA 50 day at 23
last low ie full retrace 21.5


1732080725802.png


News can not come to soon.

The only positive I see is during this period of falling SP the volume has also been dropping
1732081007580.png
 
  • Like
Reactions: 8 users

Ethinvestor

Regular
Triangle.. whichever way brakes .. will likely to continue for a while….

IMG_6143.png
 
  • Like
Reactions: 5 users

Ethinvestor

Regular
Officially… fu….d 🤣
 

Attachments

  • IMG_6192.png
    IMG_6192.png
    474.2 KB · Views: 81
  • Haha
  • Like
Reactions: 3 users

Ethinvestor

Regular
update ..false break out before…..officially defu…d.. meaning we good 🤣
but a bit weary.. as this is mum and dad money now pushing it up as most institutional investors on holidays now…
 

Attachments

  • IMG_6359.png
    IMG_6359.png
    500.3 KB · Views: 46
Last edited:
  • Like
Reactions: 9 users

TheDrooben

Pretty Pretty Pretty Pretty Good
update ..false break out before…..officially defu…d.. meaning we good 🤣
but a bit weary.. as this is mum and dad money now pushing it up as institutional investors on holidays now…
Thanks @Ethinvestor 50M volume.....must be some big mum and dad's out there 😁
 
  • Like
  • Haha
Reactions: 9 users

Ethinvestor

Regular
I ment to say ”most” institutional… 🤣 and also that most shorters, sellers etc also not in the market this time of the year.. 🙏😊
 
  • Like
Reactions: 4 users
The last big longer term PF failed
A new one has formed, looks good atm.
Breaking of the descending triangle on larger volume also positive.
Now a back test of the triangle or retest/confirmation of the lower tine of the PF would be excellent.


1735000880037.png


One 5 year architectural license is all we ask for Christmas, the new year or the January CES conference.
 
  • Like
  • Fire
Reactions: 16 users
The set up is awesome for a trend in the direction we have been hanging for
The GUPPY MAs are all in the correct order. Only the 200 SMMA left to point up.


1735022757597.png
 
  • Like
  • Love
  • Fire
Reactions: 18 users

Ethinvestor

Regular
If the uptrend continues we could be looking at a 50/200sma golden cross in a few weeks..........(blue lines mine). AIMO

View attachment 72863
Well we definitely crossed today the golden cross :)
 

Attachments

  • IMG_6371.png
    IMG_6371.png
    426.8 KB · Views: 63
  • Like
Reactions: 9 users
Or we could go out on a boxing day run and hit the median tine and repeating range target before a pull back. lol
A healthy period of stabilization here would be fantastic
1735280251608.png
 
  • Like
  • Fire
Reactions: 4 users

manny100

Top 20
From a long term point of view it looks bullish and notice how when the 50, 20 and 10 week EMA's converge a breakout follows. A bull run from May/June 2020 and Nov'21.
A shocker of a long bear run from Oct/Nov'21.
At the moment we are seeing a convergence of these weekly EMA's.
ema 10 week = 26.4 cents, EMA 20w = 24.7 and the EMA 50w = 25.7.
Will we see history repeat? Would be good to see a decent run up to close gaps above?
Its a weekly chart so we can expect to see some intra weekly dips as well as red weeks on the way up if that is the journey it takes.
There is a gap above at 46 cents from Feb'24 to fill as well as a gap above at $1.925 from Jan'22.
Its wait and see.
 

Attachments

  • BRN WK 27dec 24.png
    BRN WK 27dec 24.png
    12.1 KB · Views: 52
  • Like
Reactions: 10 users

Ethinvestor

Regular
After Golden Cross Confirmed we have a break out confirmed now as well !!! …. And a new uptrend.. as well… !!! Definitely Bullish. Todays close at previous resistance 36-37 Cents, next resistance is at 50 cents most likely will hit (70%-80%) - unless some bad news or some pullback beforehand.
But the impulsive move for 3 days on such a high volume is a very strong signal technically.
Fundamentally no news… somebody knows something?🫢 hmmm… 20 years ago when i was day trading… I loved these signals as I seen this as an inside info by somebody… and usually i would be profitable based on what the chart is telling me..
Anyway good news … and nice christmas gift… not because what the price achieved, but how the chart looks like… this can be the beginning of the new uptrend… after 2 years of downtrend… hopefully there is good news coming out and not just short term speculation ….
Just my 2 cents - DYOR :)
 

Attachments

  • IMG_6392.png
    IMG_6392.png
    426.8 KB · Views: 85
Last edited:
  • Like
  • Fire
  • Love
Reactions: 24 users

Andy38

The hope of potential generational wealth is real
After Golden Cross Confirmed we have a break out confirmed now as well !!! …. And a new uptrend.. as well… !!! Definitely Bullish. Todays close at previous resistance 36-37 Cents, next resistance is at 50 cents most likely will hit (70%-80%) - unless some bad news or some pullback beforehand.
But the impulsive move for 3 days on such a high volume is a very strong signal technically.
Fundamentally no news… somebody knows something?🫢 hmmm… 20 years ago when i was day trading… I loved these signals as I seen this as an inside info by somebody… and usually i would be profitable based on what the chart is telling me..
Anyway good news … and nice christmas gift… not because what the price achieved, but how the chart looks like… this can be the beginning of the new uptrend… after 2 years of downtrend… hopefully there is good news coming out and not just short term speculation ….
Just my 2 cents - DYOR :)
Great analysis and feedback, much appreciated. Let’s get on the uptrend people!! 💪
 
  • Like
  • Love
Reactions: 11 users
Just some quick chart thoughts more around poss resist / supp areas to watch.

Couple of daily & a weekly.

Made some basic notations here & there.

1735568309122.png


1735568369746.png


1735568400522.png
 
  • Love
  • Like
  • Fire
Reactions: 6 users
Just some quick chart thoughts more around poss resist / supp areas to watch.

Couple of daily & a weekly.

Made some basic notations here & there.

View attachment 74992

View attachment 74993

View attachment 74994

Was having a quikc look at a 15 min chart for today as below with some notes on it.

As per notes on my 1st chart prev post above, saw a little weakness today which could just be some profit taking but the next couple of bars for the new year worth watching.

1735655663709.png
 
  • Like
  • Fire
  • Love
Reactions: 8 users
Do we fly to the upper PF Tine before a retrace?

1735806144142.png
 
  • Like
  • Love
  • Fire
Reactions: 3 users
The last of the MMAs to turn upward is at least flat lined. My bias sees it marginally pointing upward after todays activity

1735807399747.png
 
  • Like
Reactions: 5 users

old punter

Emerged
Afternoon all , I would like to post a few charts here if ok ?
First trade on day 13 of the mirror pattern at 32.5 .
BRN entered at 32.5 now 38 ish but looks to fast for the mirror pattern so could be a major mo...png
BRN CHART IN PROGRESS DATES AND PRICE plus additions 15 CENT HIGHS.png BRN CHART IN PROGRESS DATES AND PRICE plus additions 15 CENT HIGHS.png

Now waiting for the low on 28/2/25 or 3/3/25 , which will be 2 months from the high of 45 c . Price must hold the 27.5 low for this mirror pattern to work and if so it implies the next spike high will be 60 cents based off the chart , view the dates and prices to see .Obviously I didn't make this pattern and I haven't updated it for a few days as where it currently sits is a random walk in my view . The date of the 10th day of the month could also be important and bought in the last low but am guessing the top date remains more important 28 -3rd of March . For the silly billies across the road [only one or 2 ] who blatantly ramp price daily based on some crap shorting theory , they have been exposed on brn and pls threads constantly but still allowed to post .
 
  • Like
Reactions: 1 users

old punter

Emerged
Try again , for this mirror pattern to work the low should come in 2 months from the high , whether that is double bottom at 27.5 or a higher bottom we don't know but with the high at 3/1 time is approaching at 3/3 which could also mean 28/2 [always give or take a day or 2 lol ] note the first high on 10/10 took one month from lows and the 3rd low [red line came in 2 months from the top . MIRROR PATTERNS ARE NOT PERFECT but the 13 days trade worked but the top on 24/1 didn't make sense to me but if u consider the first high at 32.3 may of been a fake break and 30 was confirmation on price ? which also meant the high at 45 cents was relevant . 15 cent low 30 cent top and now 45 top implying 60 cent top for the next range up [GIVE OR TAKE ] THE ONLY THING THAT SCARES ME IS THE MONTHLY CHART AND A RED BAR but as long as price holds 27.5 which is based of the low at 15.5 then 21.5 and now 27.5 all 6 higher GET MY DRIFT etc etc cheers old phart .

BRN CHART IN PROGRESS DATES AND PRICE plus additions 15 CENT HIGHS.png
 
Top Bottom